How to get useful debug screens for latte file errors?

- bernhard
- Member | 54
Hi!
I've built a module for the ProcessWire CMS to use Latte which is quite popular. Now a user asked how we can get more helpful error messages in latte files, and I don't know :)
Another user has built “TracyDebugger” which includes the great tracy debugging tool into the ProcessWire CMS.
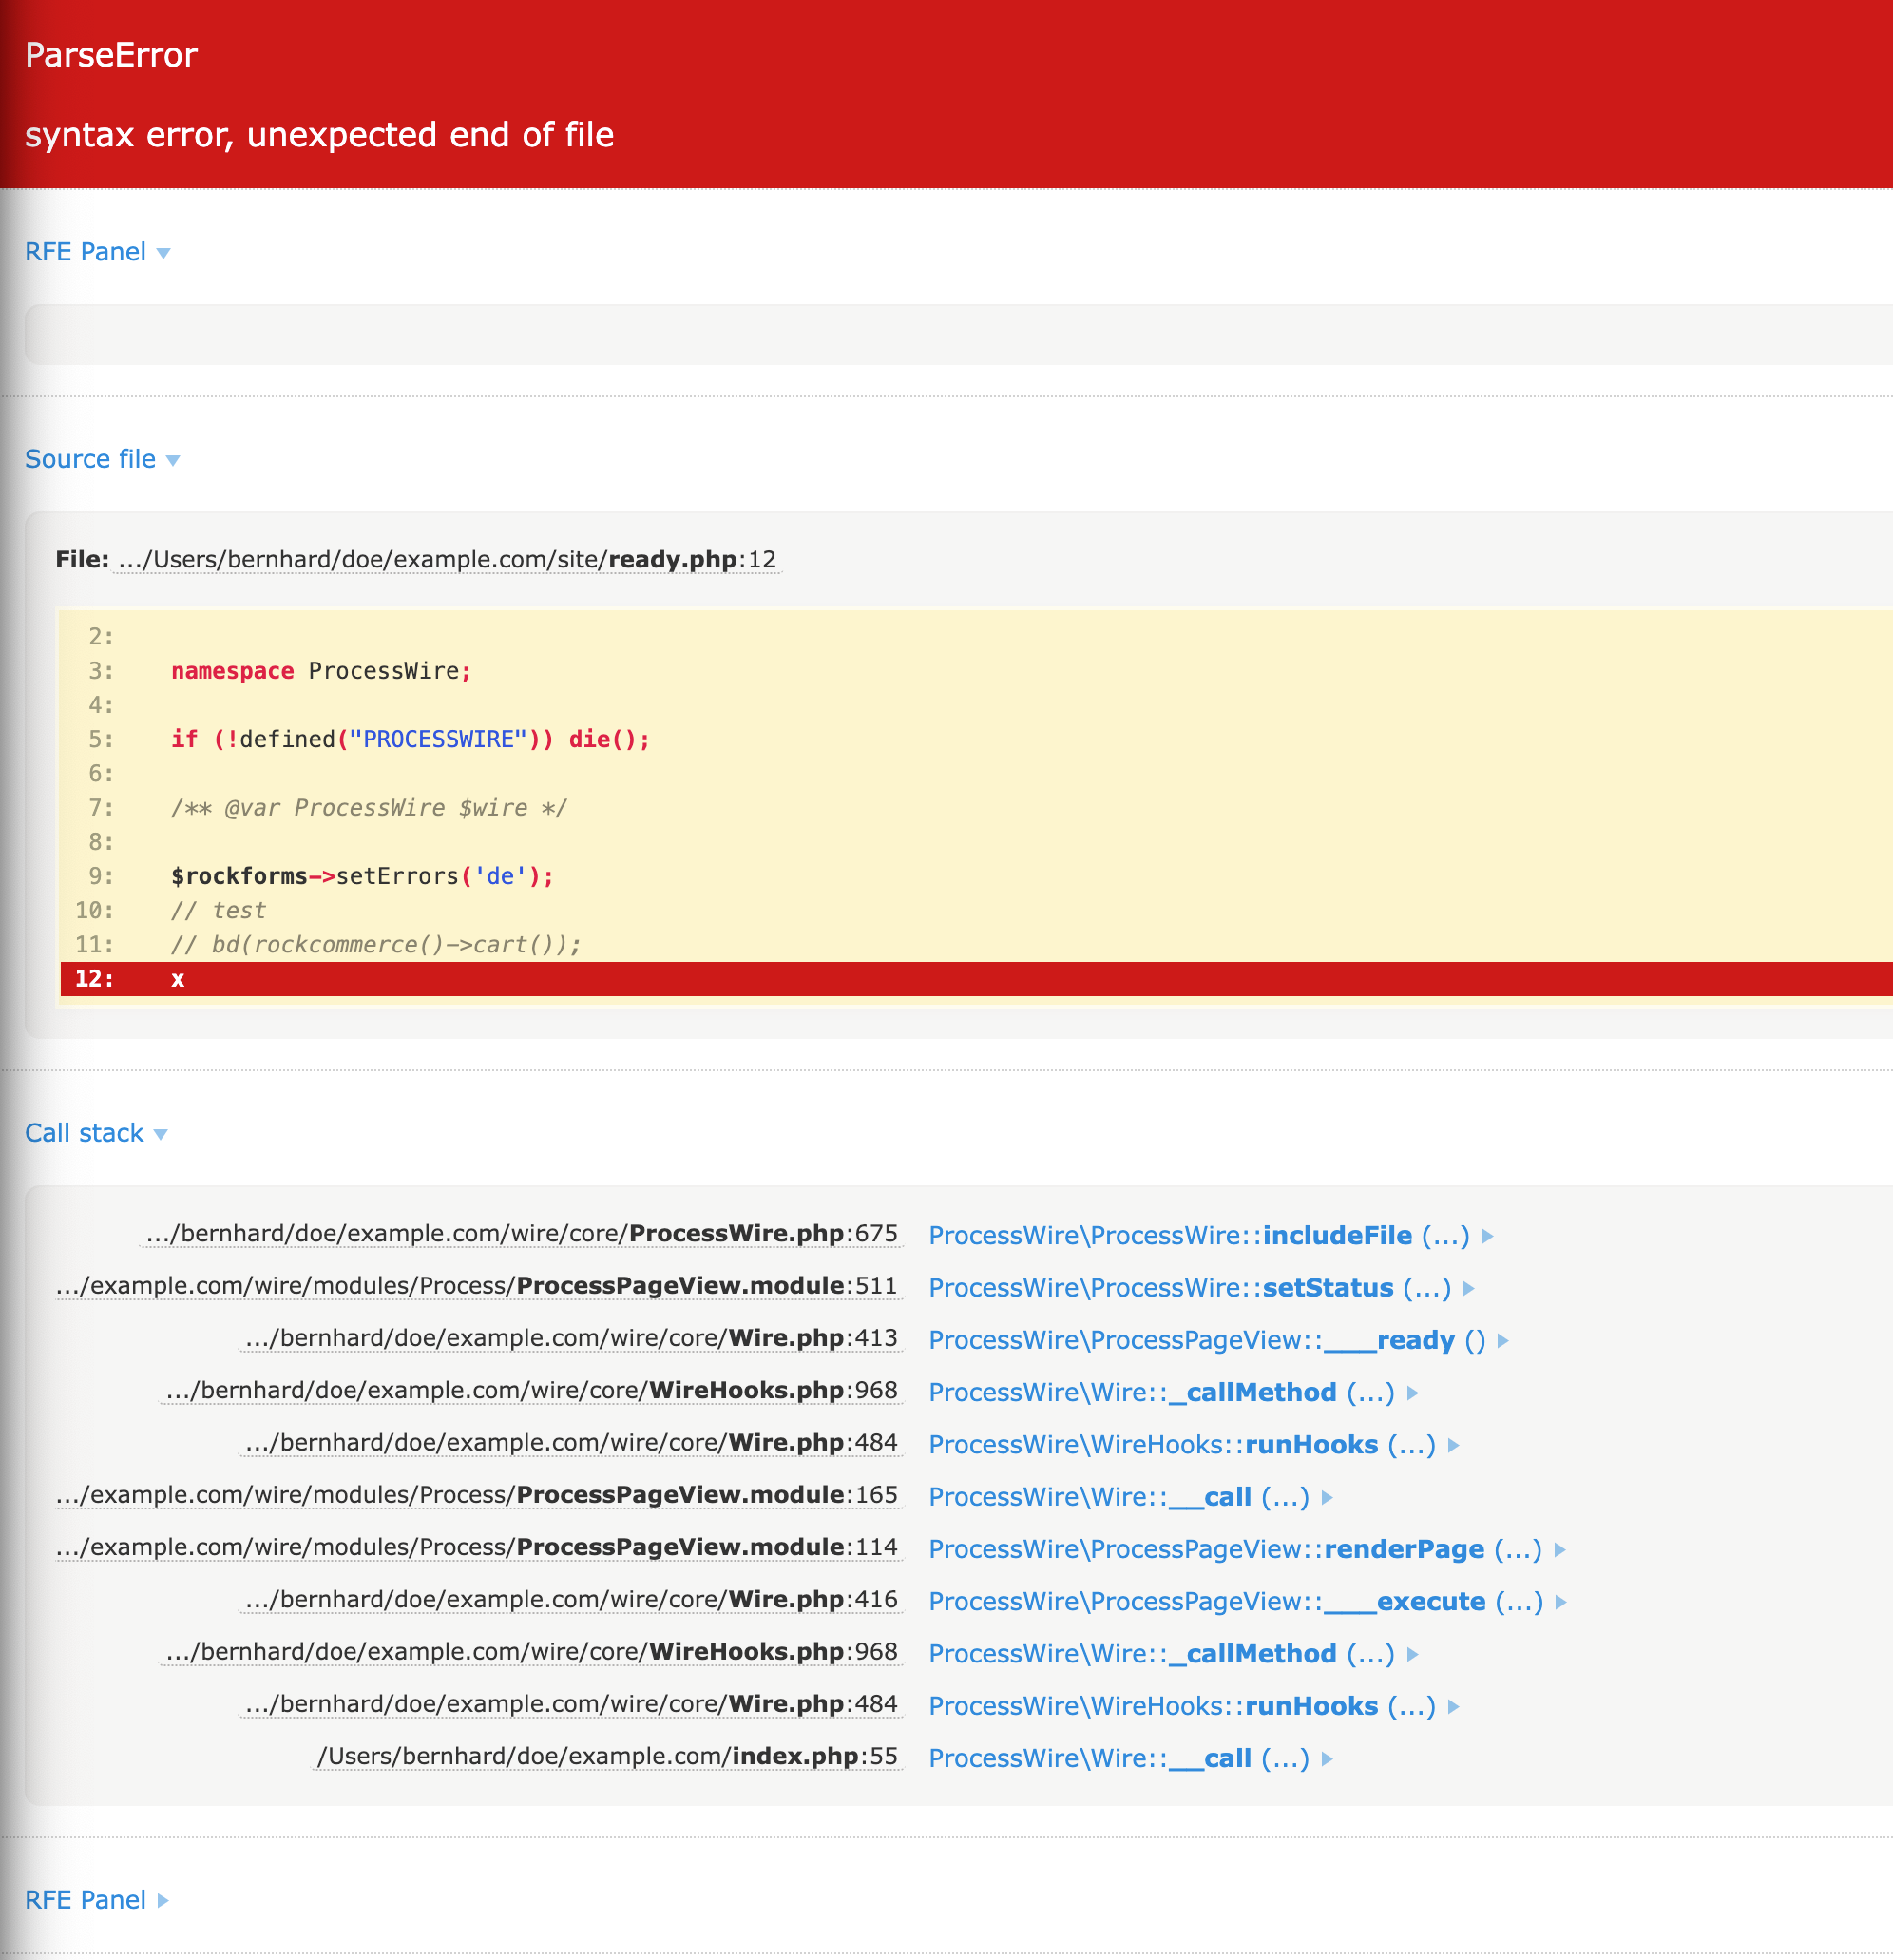
When having a syntax error in a php file the error looks like this (which is great):

But when having an error in a latte file, all we get
this: Call to undefined function foo()
In this example I put this undefined function in /site/templates/layout.latte, but with more complex scenarios it can be really hard to find out where the issue actually occurred. It might be a generic method name like save() or whatever and you don't get any information in which file the error was thrown. No stack trace. Nothing.
Is that because we are using Latte standalone? Or is that intended? Can we improve that situation?
Thx a lot in advance!
Last edited by bernhard (2024-09-22 21:44)

- Marek Bartoš
- Nette Blogger | 1321
Just add this to your Tracy initialization
if (class_exists(\Latte\Bridges\Tracy\BlueScreenPanel::class)) {
	\Latte\Bridges\Tracy\BlueScreenPanel::initialize();
}
It is done the same way in nette/bootstrap – https://github.com/…igurator.php#…
In full Nette stack, we have tabs with both generated php code and the Latte template highlighted on the blue(red)screen. Not sure if you will have to do anything else with your custom setup
Last edited by Marek Bartoš (2024-09-23 00:44)

- bernhard
- Member | 54
Hey @MarekBartoš thank you for your fast response!
Unfortunately I don't understand. I tried adding it here: https://github.com/…d.module.php#…
But that has no effect.
I add some explanations:
My module is called “RockFrontend” and is responsible for loading Latte and several other things.
A 3rd party module is called “TracyDebugger” and loads Tracy. Shows the debug bar. Shows the bluescreen etc…
My module properly shows the tracy debug bar, but as soon as I put something
like {foo()} in a .latte file I get only a whitescreen with
call to undefined function foo(). Nothing more. No file path. No
call stack.
Is that something that has to be changed in the TracyDebugger module or in my RockFrontend module when loading latte?

- Marek Bartoš
- Nette Blogger | 1321
The code I shared is for making Latte debugging easier by showing you the error in .latte file along with the generated .php file. Keep it, it will help you once you solve the current problem.
Otherwise, it should just work. As long as Content-Type is set to text/html and Tracy is enabled and in debug mode (set early enough in the request lifecycle), it should work. There is nothing special in Latte itself that would prevent Tracy bluescreen from being displayed.
Last edited by Marek Bartoš (2024-09-23 11:36)

- bernhard
- Member | 54
Awesome! Thx.
Your comment pointed me in the right direction. I have a try/catch in my module which just renders the error instead of throwing an exception that tracy can use for the bluescreen. I'll fix this!
Thx!
Edit: Unfortunately I can't change the topic title to [solved] … or mark it as solved in another way.
Last edited by bernhard (2024-09-23 12:51)